
SnapSale v1.3.0 introduces Insights, an analytics feature that provides sellers with detailed performance metrics for their transactions. This feature gives users visibility into profit margins, inventory value changes, and transaction breakdowns to help optimize their selling strategy.
Key Features
Transaction Performance Analytics
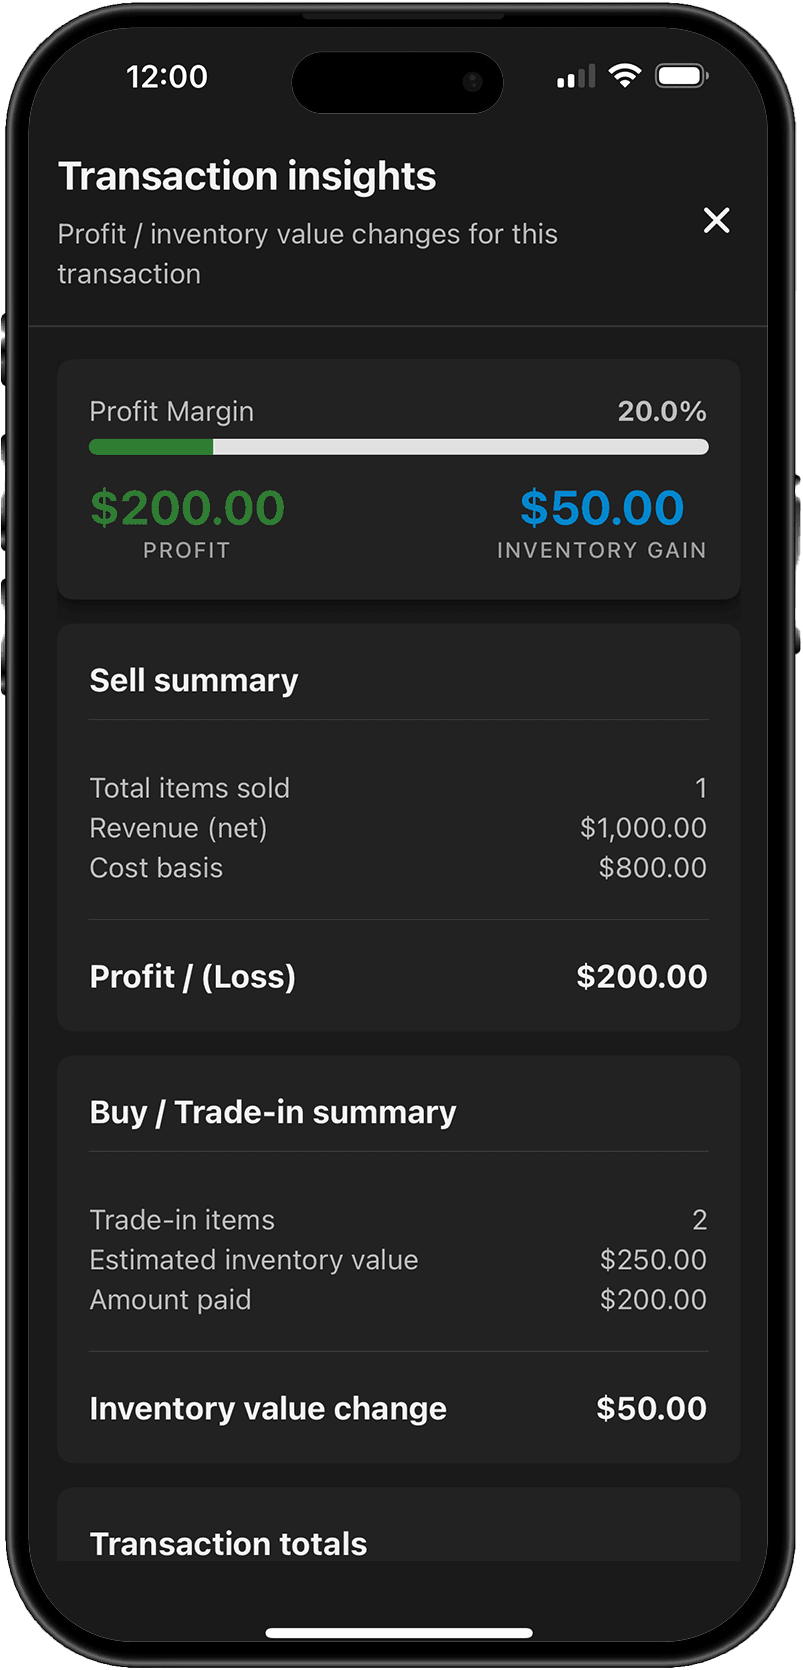
- Profit Margin Visualization: View profit margin as a percentage with a progress bar
- Real-time Profit Calculation: See the calculated profit amount
- Inventory Gain Tracking: Monitor estimated inventory value changes
Detailed Transaction Breakdown
Sell Summary
- Total items sold count
- Net revenue calculation
- Cost basis tracking
- Profit/loss calculations
Buy/Trade-in Summary
- Number of trade-in items processed
- Estimated inventory value of acquired items
- Amount paid for trade-ins
- Net inventory value change calculation
Complete Transaction Totals
- Sales total
- Buy/Trade total (shown as negative when you’re paying out)
- Final transaction balance
Where to Find Insights
Post-Transaction Analysis
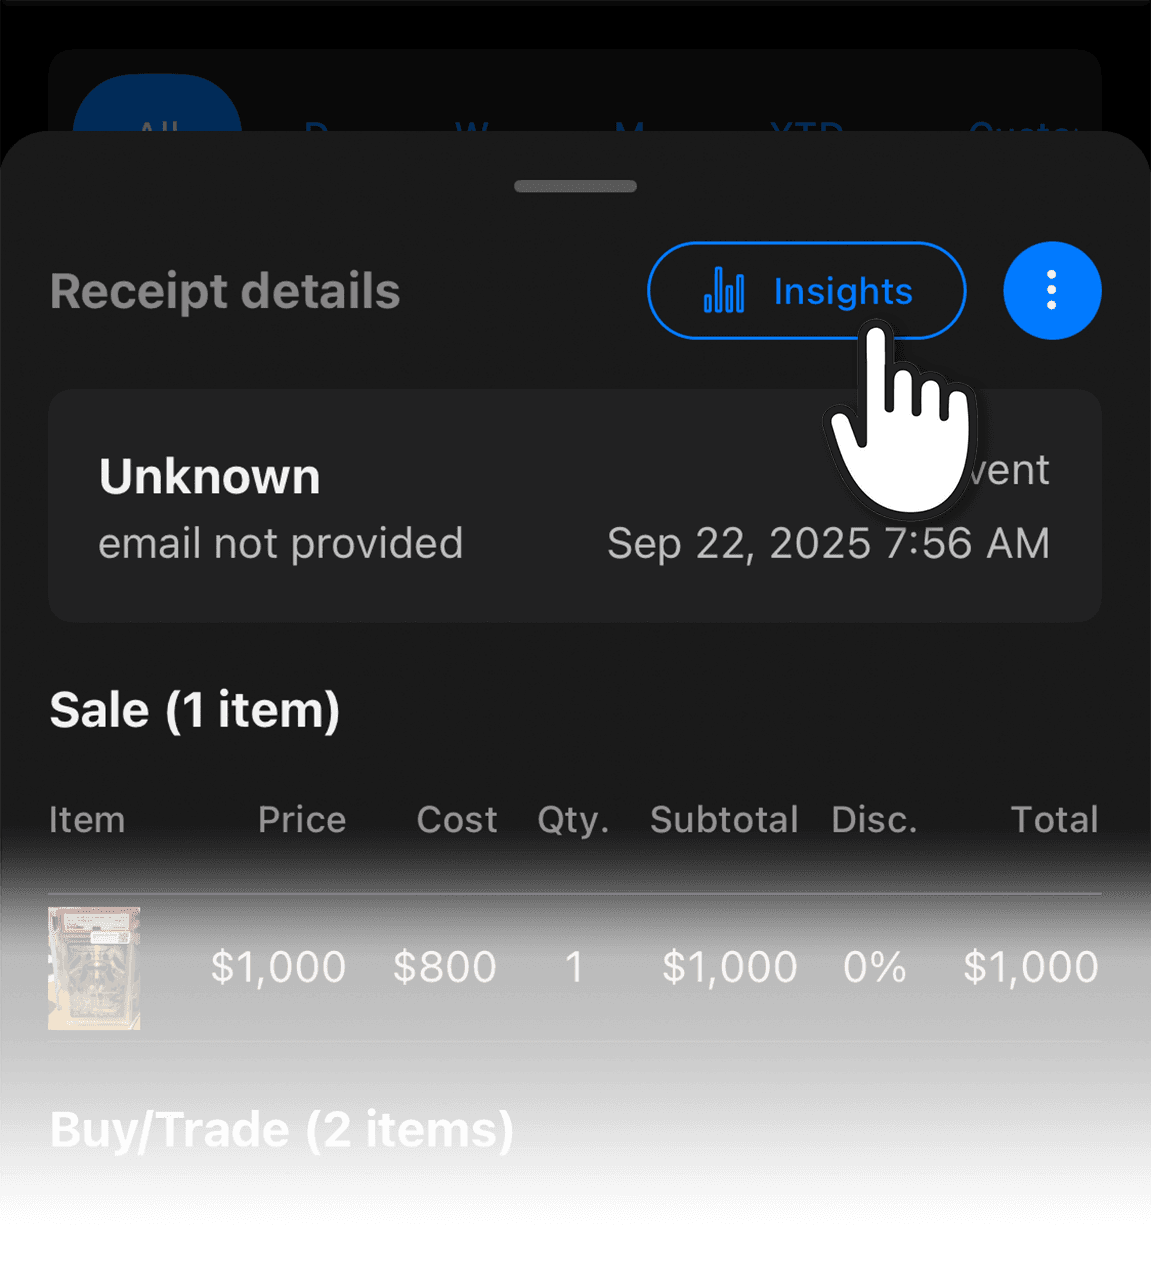
After completing a transaction, access Insights by:
- View the receipt details screen
- Tap the blue “Insights” button
- Review the transaction analytics
Pre-Transaction Assessment
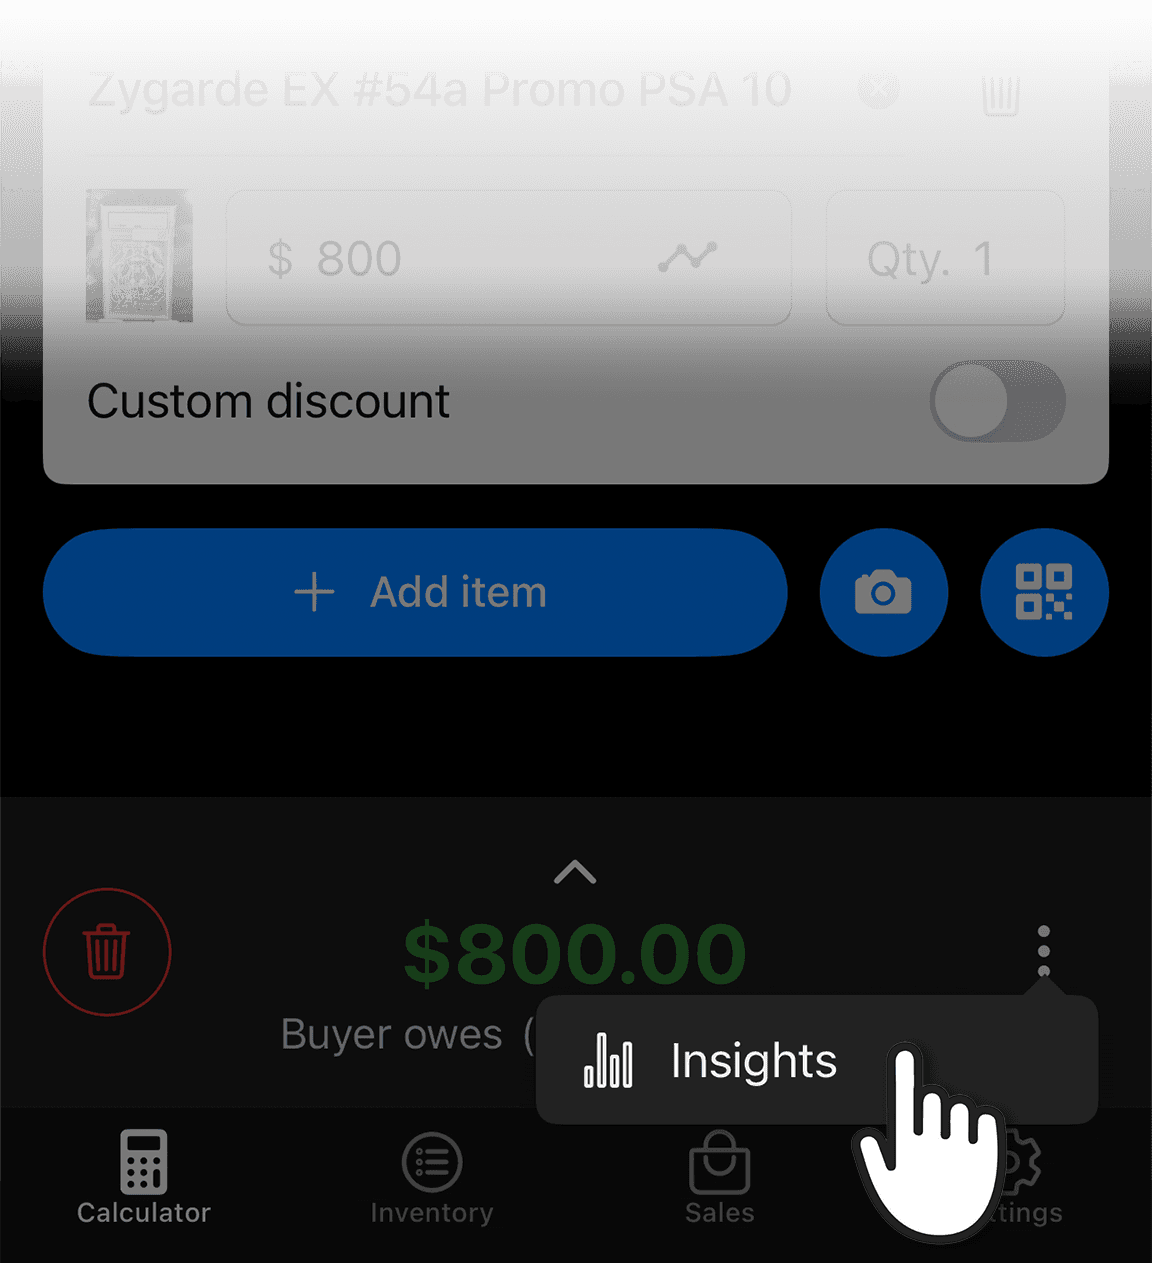
Before finalizing a sale:
- Add items to your shopping cart
- Open the ellipsis menu at the bottom of the cart and select Insights
- Evaluate transaction profitability before committing
- Adjust pricing or trade-in values as needed
Benefits for Sellers
- Informed Decision Making: Assess transaction profitability before completion
- Performance Tracking: Monitor profit margins across different transactions
- Inventory Management: Track how trades affect your inventory value
- Strategic Pricing: Use profit margin data to optimize pricing strategies
- Financial Transparency: Review a breakdown of transaction components
Example Use Case
In the provided example:
- Sale: One item sold for $1,000 with an $800 cost basis (20% profit margin and $200 profit)
- Trade-in: Two items acquired for $200 and valued at $250 in inventory
- Net Result: $200 profit from the sale, $50 estimated inventory gain, and an $800 final transaction total
Technical Notes
- Insights are calculated in real time based on inventory cost tracking
- Profit margins are computed using the established cost basis for items
- Inventory valuations reflect market estimates entered for trade-in items
- Financial calculations factor in applied discounts